This is an excellent truffle: A Periodic Table of Visualization Methods. Excellent source of inspiration. Some visualisations are known, some are inspiring (at least to me). Here are the categories:
- Data visualisation
- Information visualisation
- concept visualisation
- strategy visualisation
- metaphor visualisation and
- compound visualisation
And the whole thing looks like this:
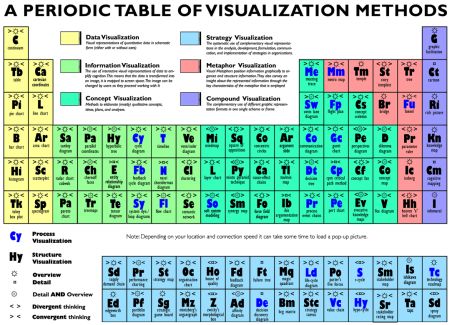
But you should really click through to the table (made in Flash) itself, because for each of the squares, the visualisation is shown as a popup.
 Wo ich sonst so bin...